I Built a Tiny GPU Simulator to See What Happens When Threads Execute in Parallel
How building a visual simulator taught me more about parallel computing than months of reading CUDA documentation

I was three hours into debugging a CUDA kernel when I realized I had no idea what was actually happening.
The code compiled. It ran. It even produced output-just not the right output. Somewhere inside that GPU, thousands of threads were executing my instructions in parallel, but I was blind to it all. No print statements. No step-through debugger. Just a black box that either worked or didn’t.
That’s when I started sketching what eventually became TinyGPU.
The Problem with Learning GPU Programming
GPUs are incredible machines. They can execute thousands of operations simultaneously, making them essential for everything from graphics rendering to machine learning. But there’s a catch: they’re nearly impossible to understand by just reading documentation.
The mental model is weird. Unlike CPUs where you think about one instruction executing at a time, GPUs run the same instruction across hundreds of threads simultaneously. They have this thing called “SIMT” (Single Instruction, Multiple Threads) that sounds simple until you try to reason about what happens when threads diverge, or when they need to synchronize, or when they access shared memory.
Most learning resources give you one of two extremes: oversimplified analogies that don’t transfer to real code, or industrial-grade tools like Nsight that assume you already understand everything.
I needed something in between. Something I could see.
The Insight That Changed Everything
The breakthrough came when I stopped thinking about building a “realistic” GPU simulator.
Real GPUs are fantastically complex-warp schedulers, register allocation, cache hierarchies, memory coalescing. Modeling all of that would take years and miss the point entirely.
What if I just modeled the concepts? The bare minimum needed to understand how parallel execution actually works?
That constraint ”simplicity over realism” shaped every design decision that followed. If a feature didn’t directly illuminate how threads coordinate and execute, it got cut.
How TinyGPU Actually Works
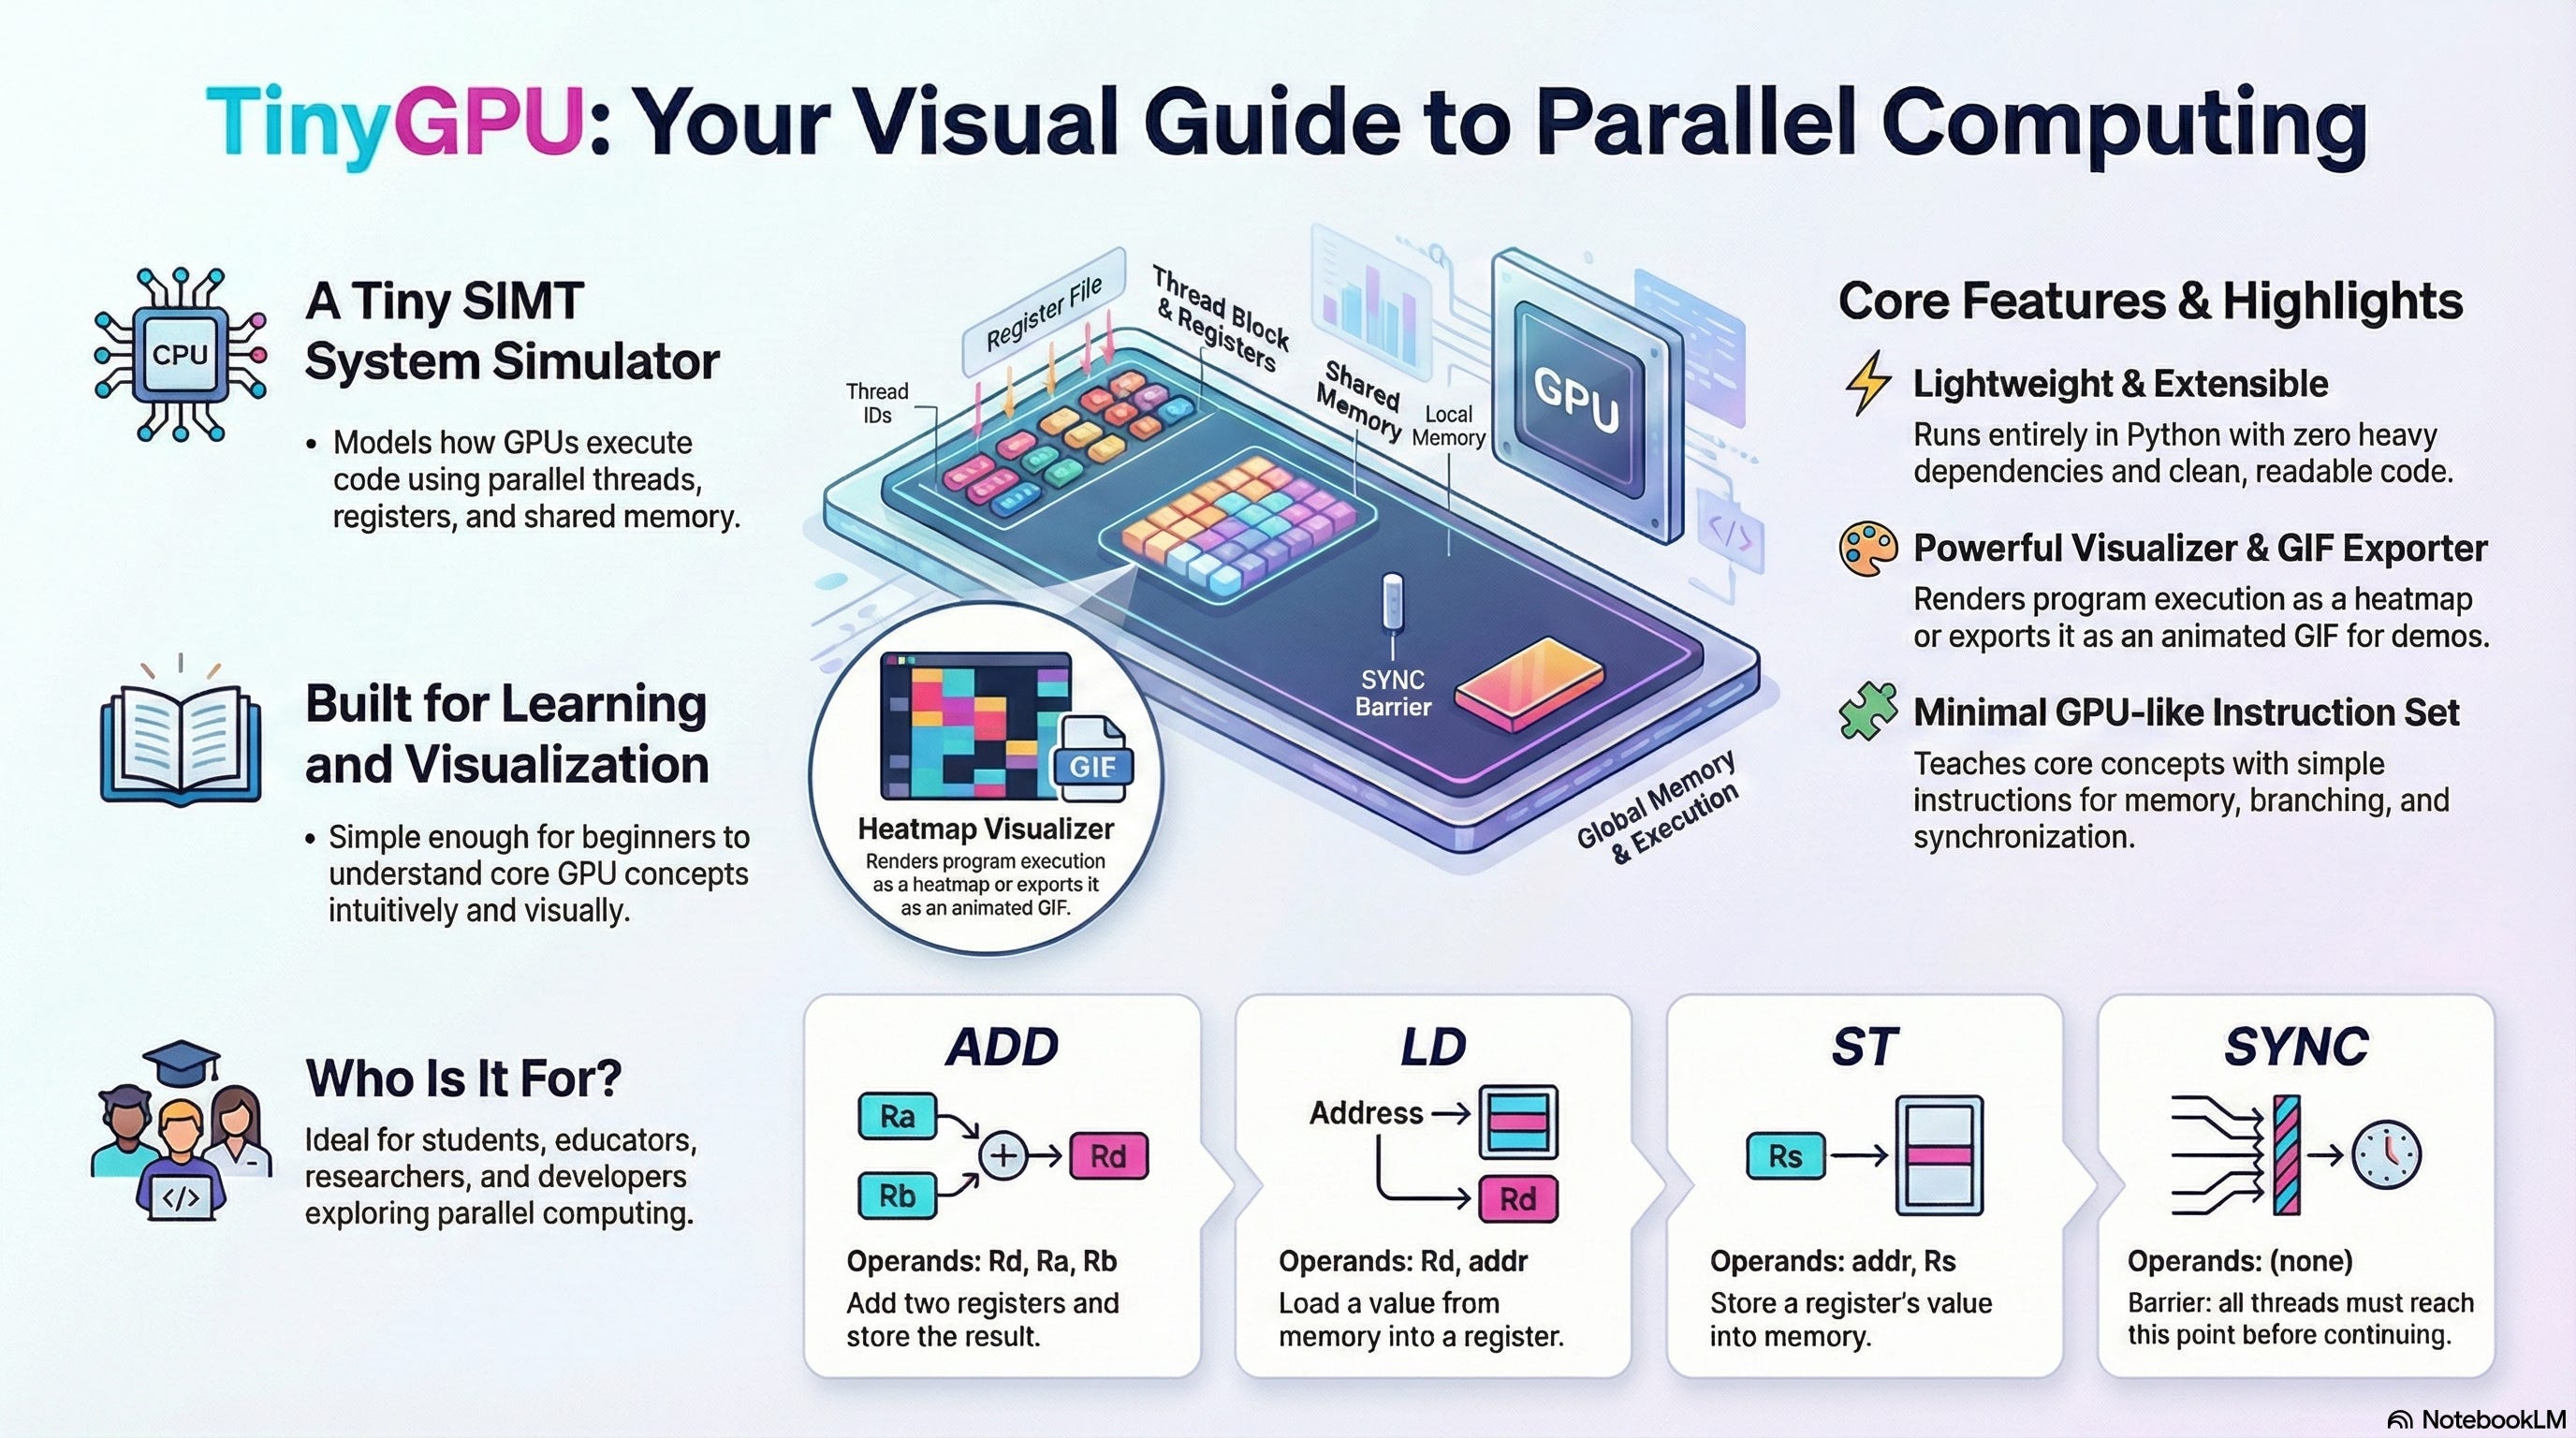
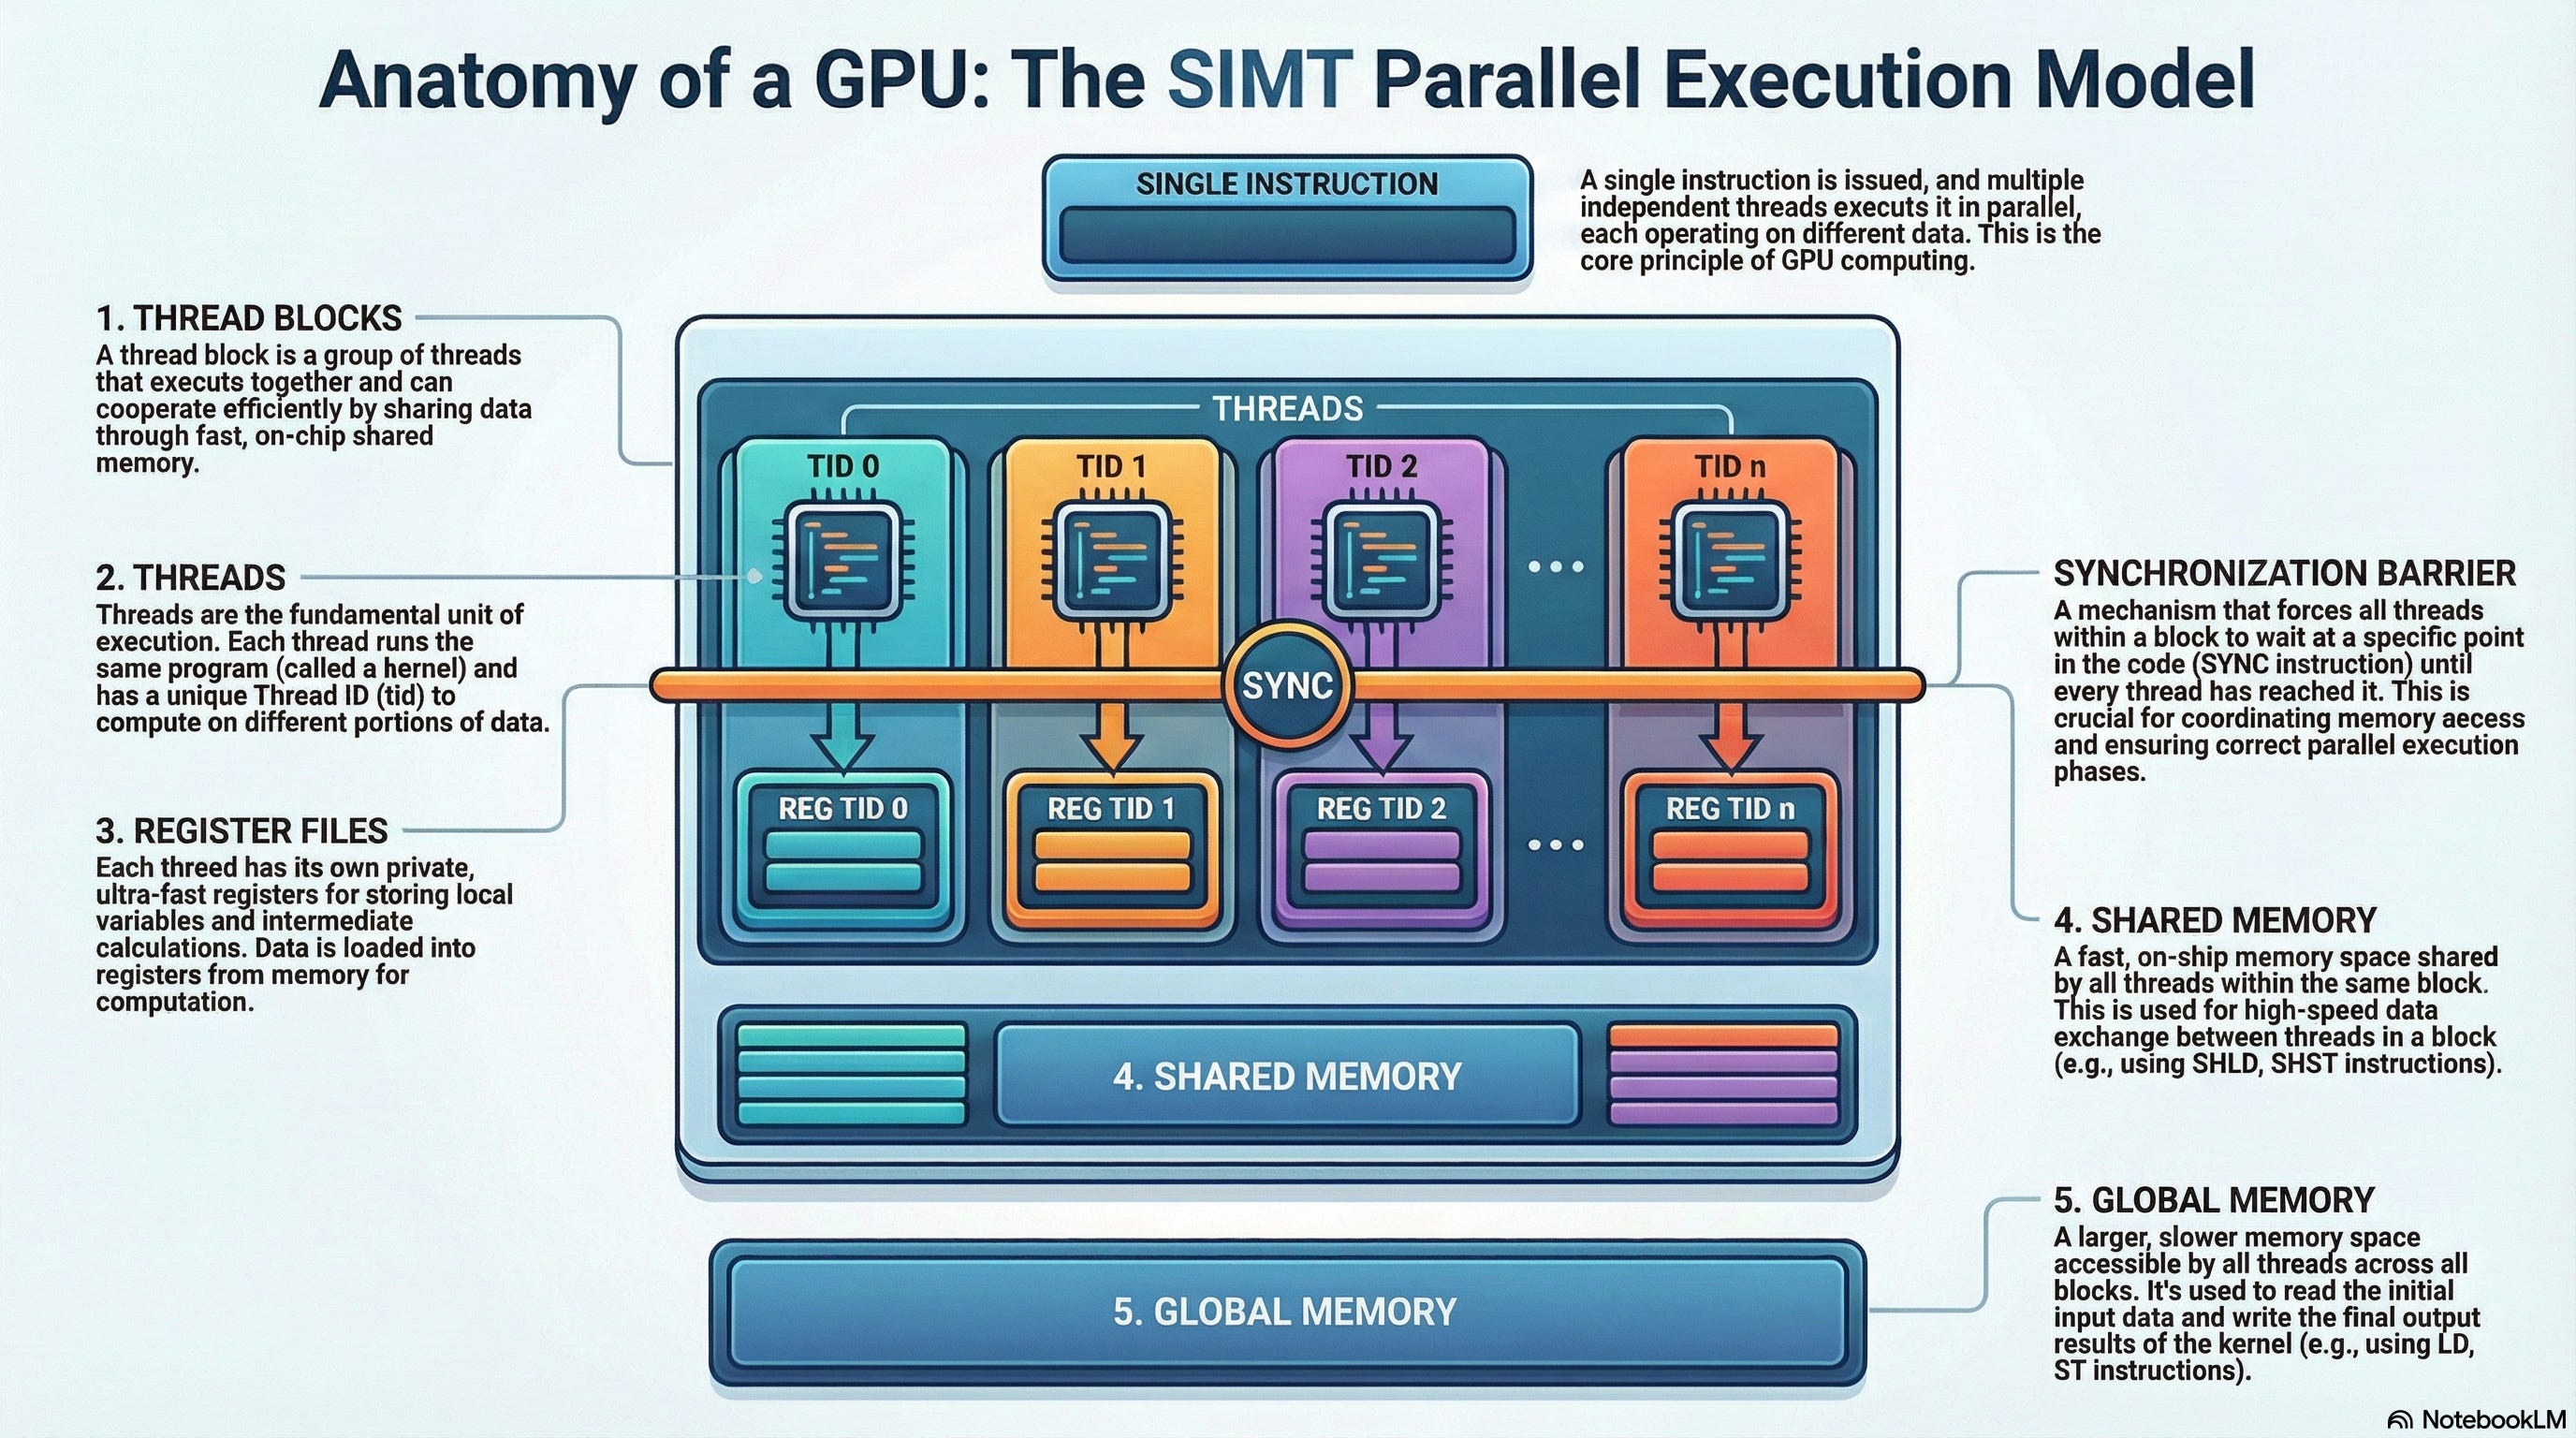
At its core, TinyGPU is a SIMT execution model with just enough machinery to be interesting.
Each thread gets its own program counter and register file. They all execute the same program, but independently-meaning they can be at different instructions at different times. This is critical for understanding thread divergence.
There’s a shared global memory space where threads can read and write values. There’s also shared memory within thread blocks for faster coordination.
The instruction set is deliberately minimal: basic arithmetic (ADD, MUL), memory operations (LD, ST), control flow (JMP, BEQ, BNE), and synchronization (SYNC).
That’s it. No floating point, no fancy intrinsic’s, no texture sampling.
But here’s the key part: every single cycle of execution is tracked and can be visualized.
The Build: Three Decisions That Mattered
Decision 1: Per-Thread Program Counters
Early versions tried to keep threads perfectly synchronized. If one thread hit a conditional branch, all threads had to wait. This made the implementation simpler but completely missed the point.
Real GPUs do handle divergence-threads within a warp can temporarily execute different paths. So I gave each thread its own PC and let them diverge naturally.
The tradeoff? More complexity in the execution loop. But the educational value was undeniable. You could finally see what happens when threads take different branches.
Decision 2: Making SYNC Actually Synchronize
The synchronization barrier instruction (SYNC) sounds simple: all threads must reach this point before any can continue.
But implementing it correctly was tricky. Threads don’t execute in lockstep. Some might reach the barrier quickly while others are still processing earlier instructions. If you’re not careful, you get deadlocks or threads that zip past the barrier when they shouldn’t.
The solution was a barrier counter. When a thread hits SYNC, it increments the counter and enters a waiting state. Only when all threads have incremented does the counter reset and execution resumes. Simple in concept, but it took several iterations to get the state management right.
Decision 3: Visualization as First-Class Feature
Most simulators treat visualization as an afterthought-maybe you can dump register values to a text file if you’re lucky.
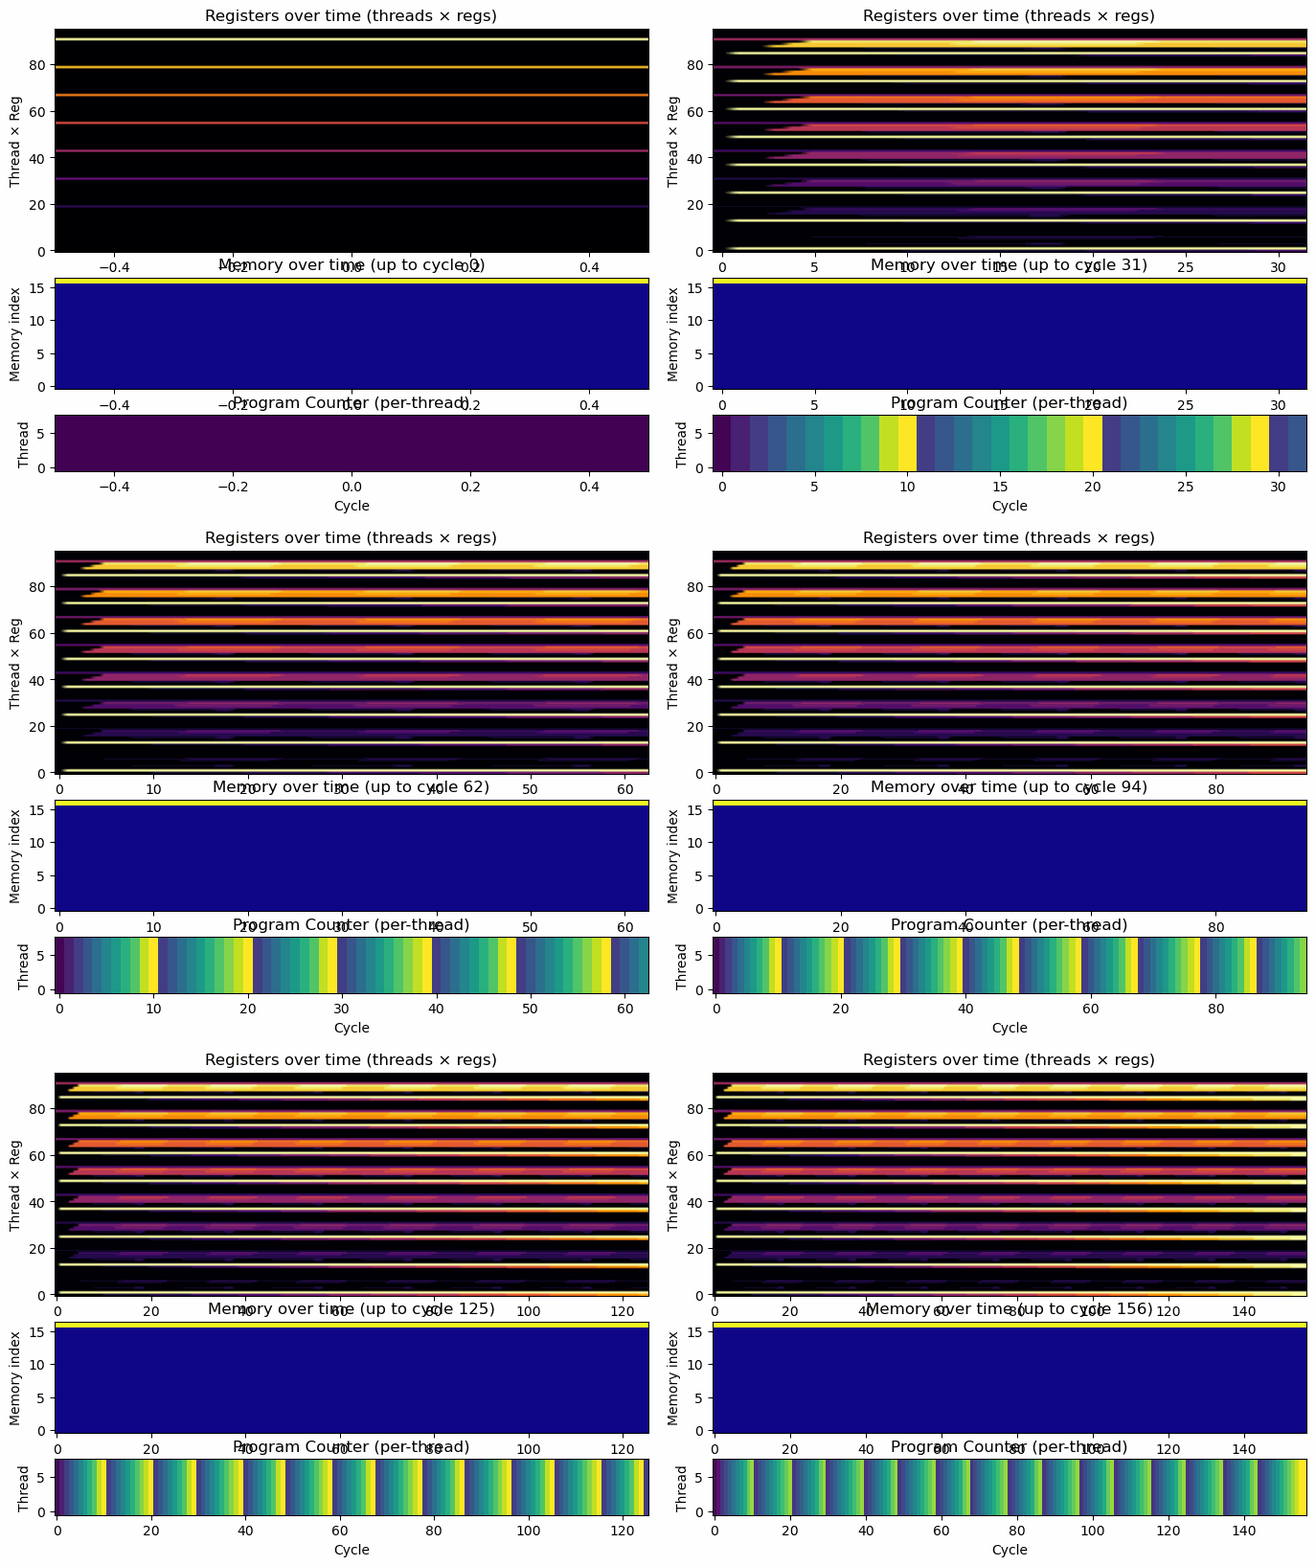
I made visualization core to the design. Every instruction execution is logged with full state snapshots: register values, memory contents, program counters, active threads. This data feeds into a heatmap renderer that shows you exactly what changed each cycle.
The killer feature? Export to animated GIF. You can watch an entire parallel sorting algorithm execute step-by-step, seeing threads coordinate through barriers and swap memory values. It turns an abstract algorithm into something you can understand by watching.
A snippet of assembly code for odd-even sort :
SET R0, 0        ; phase_counter
SET R1, 8        ; num_phases == N
SET R3, 0        ; parity

loop_phase:
    ; compute base index = tid * 2
    MUL R4, R7, 2      ; R4 = tid * 2
    ADD R5, R4, R3     ; R5 = index = tid*2 + parity
    ADD R6, R5, 1      ; R6 = index + 1
    CSWAP R5, R6       ; compare & swap memory[index], memory[index+1]
    SYNC               ; synchronize threads across the phase

    ADD R3, R3, 1      ; parity = parity + 1
    BNE R3, 2, noreset
    SET R3, 0
noreset:
    ADD R0, R0, 1
    BNE R0, R1, loop_phase

done:
    JMP done
A frame from the execution GIF showing the heatmap visualization of threads, registers, and memory during one cycle of the sort :
What Went Wrong (And What I Learned)
The first version had threads executing in perfect parallel-all on the same instruction at the same time. It looked clean but was fundamentally wrong.
Turns out modeling realistic execution is harder than modeling synchronized execution. The bug that took the longest to find? A race condition in how threads were checking the synchronization barrier. Some threads would see the barrier as cleared before all threads had actually incremented the counter. The solution required adding explicit barrier state and more careful ordering of checks.
I also vastly underestimated how hard it would be to pick good example programs. Writing a parallel odd-even sort that’s simple enough to follow but interesting enough to demonstrate real synchronization challenges took a dozen iterations.
Too simple and it doesn’t show the power of parallelism. Too complex and beginners get lost in the algorithm rather than the execution model.
The visualization almost killed the project. My initial approach stored full state history in memory, which scaled terribly. Running an 8-thread program for 200 cycles would consume gigabytes of RAM. I had to switch to a streaming approach where states are rendered to frames immediately and discarded. Not as flexible, but actually usable.
Seeing It In Action
The short video below gives a visual overview of how TinyGPU came to be and what problem it is designed to solve.
Rather than a line-by-line technical walkthrough, the video focuses on the motivation behind the project, the core idea of making parallel execution visible, and a high-level demonstration of what the simulator produces.
The most illuminating moment is watching the odd-even sort execute. You can literally see threads synchronizing at barriers, comparing values in memory, and swapping them when needed. Each phase of the sort is a wave of activity across threads, all coordinating through SYNC instructions.
Another powerful example is the parallel reduction-summing an array by having threads repeatedly combine values. You watch the active thread count halve each iteration as threads finish their work and idle, while the remaining threads carry more of the computational load.
What Actually Works (And What Doesn’t)
TinyGPU successfully demonstrates core GPU concepts: SIMT execution, thread divergence, shared memory, and barrier synchronization. The visualization makes these abstract ideas concrete. Students can write a simple kernel and immediately see how threads coordinate.
The instruction set is expressive enough to implement real algorithms: sorting, reductions, convolutions, even simple ray tracing if you’re patient.
But it’s definitely a learning tool, not a performance simulator. There’s no warp scheduling, no memory coalescing model, no cache hierarchy. Execution is deliberately serial (one instruction at a time) to make visualization meaningful. A real GPU would execute all these threads in massive parallel batches.
Thread count is also limited-realistically you can run maybe 32-64 threads before the visualization becomes unwieldy and memory usage spikes. Real GPUs casually handle thousands.
The memory model is simplified. Real GPUs have local memory, constant memory, texture memory-all with different performance characteristics. TinyGPU just has global and shared. Good enough to learn the concepts, insufficient to understand real-world optimization.
Three Lessons That Transferred Beyond This Project
Lesson 1: Simplification reveals truth
Stripping away complexity didn’t make TinyGPU less useful-it made the core concepts more visible. When teaching or designing, the question isn’t “how much can I include?” but “what can I remove without losing the essential insight?”
Lesson 2: Visualization changes understanding
Reading about thread synchronization is abstract. Watching it happen is visceral. The same principle applies everywhere: if you can make invisible processes visible, understanding becomes automatic rather than intellectual.
Lesson 3: Educational tools need constraints
The best learning experiences are deliberately constrained. TinyGPU’s minimal instruction set forces you to think about how things work rather than which library function to call. Constraints aren’t limitations-they’re scaffolding.
What I’d Build Next
The next major feature is dynamic warp scheduling. Right now threads execute somewhat independently. Real GPUs group threads into “warps” that execute together. Modeling this would demonstrate why divergent branches are expensive-the hardware has to execute both paths sequentially when threads disagree.
I also want to add memory access pattern visualization. Color-code memory operations by thread to show coalescing (or lack thereof). This would make the performance implications of access patterns immediately obvious.
A more ambitious extension: multi-block execution with an actual grid structure. Right now TinyGPU is basically a single block. Scaling to multiple blocks executing independently would demonstrate another level of parallelism.
There’s also a pedagogical challenge: the current examples are good, but they’re all batch algorithms. Adding interactive examples-maybe a simple particle system or cellular automaton-would show real-time parallel computation rather than just “run once and visualize.”
Why This Actually Mattered
Building TinyGPU taught me more about GPU programming than months of reading CUDA documentation.
Not because the simulator is realistic-it’s deliberately not-but because it made the mental model explicit. Every abstraction in parallel computing (SIMT, barriers, shared memory) became concrete machinery I could inspect and modify.
The larger lesson is about understanding complex systems. Sometimes you don’t need to study the real thing-you need to build a simplified version that captures the essence. The act of deciding what to include and exclude forces you to understand what actually matters.
GPUs are still black boxes in production. But now when I write CUDA kernels, I can visualize what’s happening inside. I can reason about synchronization and divergence because I’ve seen it play out cycle by cycle.
That mental model-that’s what TinyGPU really builds.
The code is on GitHub if you want to run it yourself.
Fair warning: you might end up spending an afternoon watching threads sort arrays in slow motion. It’s oddly mesmerizing.